
Customer Loss Analysis
By: Forest Eyster
Last Updated: 06/17/2026
Introduction
Welcome to my synthetic data analysis of customer loss at Consumer Empire. This project was designed to simulate a real world business engagement using AI generated data, with the goal of identifying the root causes of customer attrition and producing actionable retention recommendations.

The analysis focuses on surfacing the key drivers of customer loss and translating data findings into executive ready insights. All while sharpening core data analytics skills across the full project lifecycle.
Tools Used
- Claude (Anthropic) — stakeholder simulation and data generation
- PostgreSQL — data storage and SQL based analysis
- Visual Studio Code — query development and scripting
- Tableau — dashboard design and data visualization
- Git & GitHub — version control and project documentation
Creating the Company and Data
The first step was establishing a realistic business problem. Using Claude, I constructed a fictional retail company called Consumer Empire, and conducted simulated stakeholder interviews to surface operational concerns that could be driving customer loss.
Key findings from each stakeholder:
- CTO: A website navigation redesign launched in March 2023 coincided with cart abandonment rising from 68% to 76%.
- COO: Southwest and West Coast customers were experiencing delivery times of 6 to 9 days despite a 3 to 5 day promise. The Phoenix warehouse has been understaffed since the prior year.
- CMO: Discount campaigns targeting the Southwest region showed less than 3% end-to-end conversion. A total of 341 coupon redemptions were used from 12,400 emails sent. No repeat purchase tracking exists for rewards members.
With these pain points identified, I established three working hypotheses to guide the analysis:
1. Order volume and average order value declined following the March 2023 navigation redesign.
2. Southwest and West Coast regions show elevated cancellation and return rates.
3. Loyalty program members are not returning for repeat purchases.
Data Generation
Rather than working with licensed or proprietary data, I generated a synthetic dataset using Claude an approach inspired by Jess Ramos. This ensured ethical data use while enabling a realistic, messy dataset suited for cleaning practice.
The generation prompt instructed Claude to produce three interrelated tables (Orders, Products, Customers) totaling 9,567 rows each, with intentional data quality issues: missing foreign key relationships, dirty fields, and nonuniform distributions. Each table was returned as a downloadable CSV.
The Analysis
After restructuring and cleaning the dataset, I tested each hypothesis through targeted SQL queries.
Hypothesis 1 — Order volume and revenue dropped after the March navigation redesign
To evaluate this, I broke down orders by month and looked for pattern shifts around March 2023.
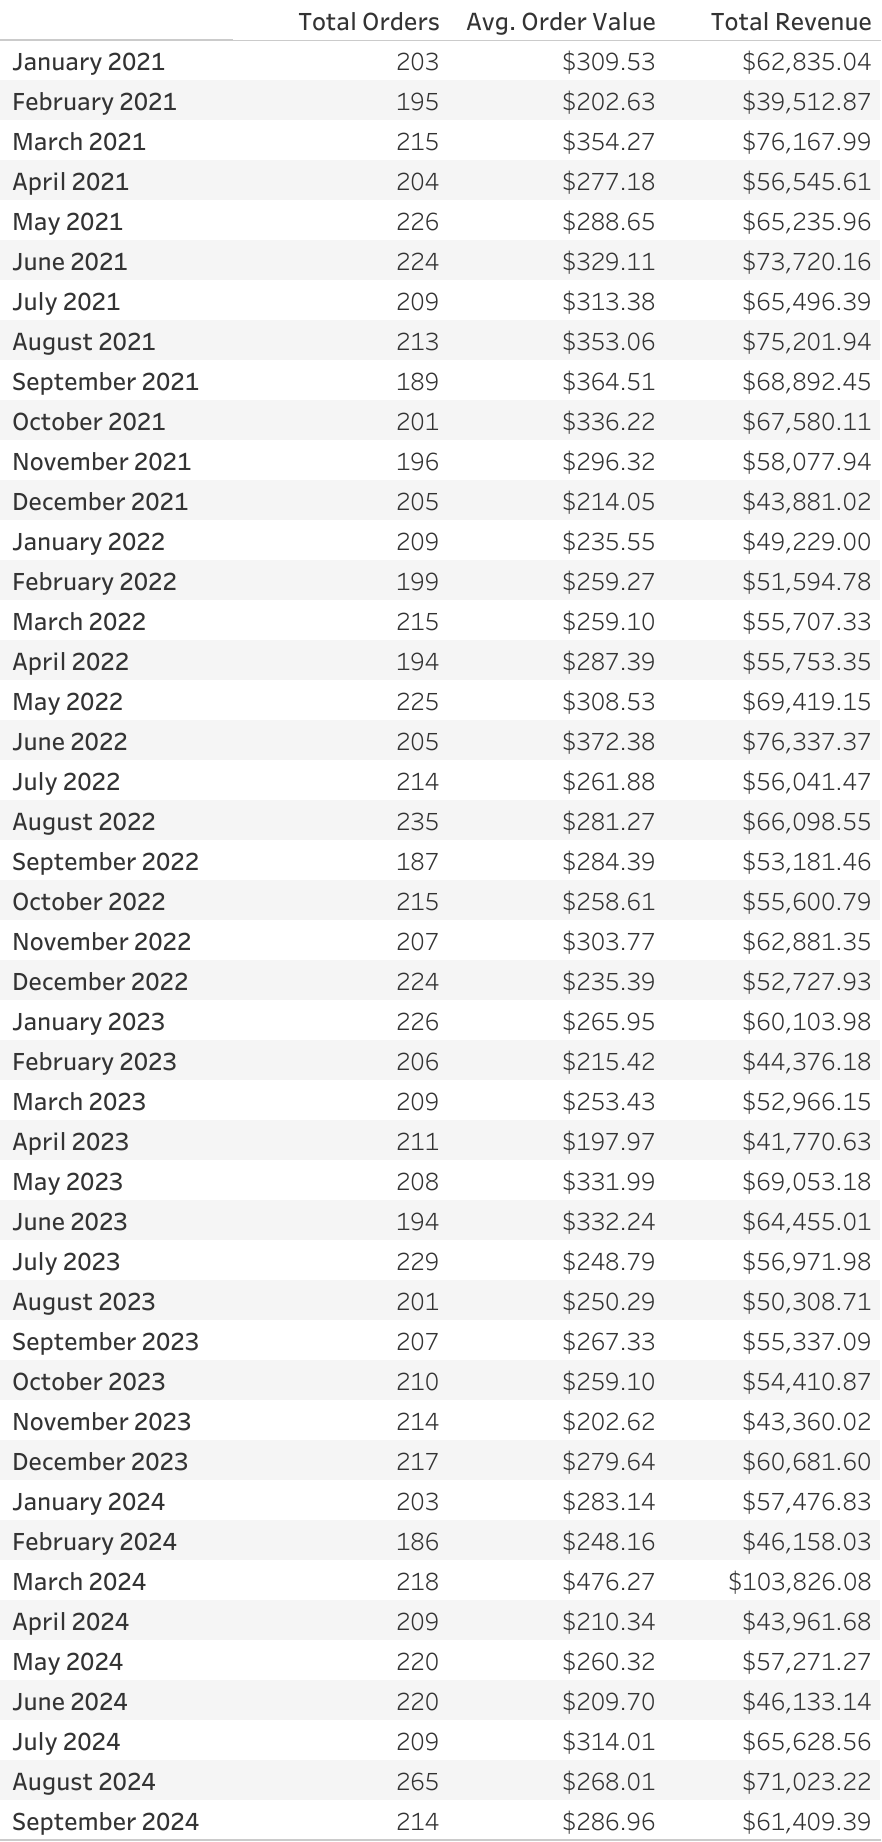
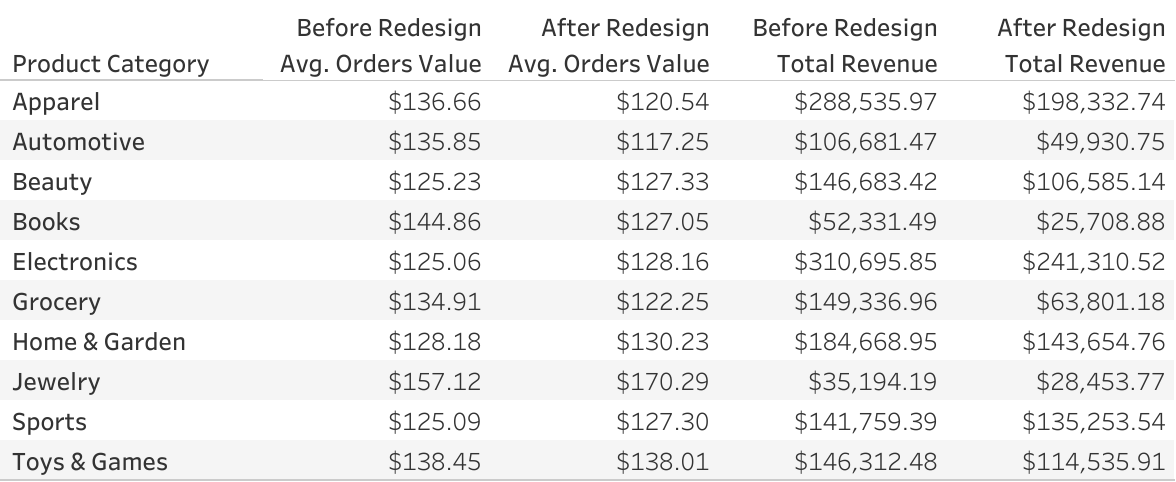
Finding: The navigation redesign coincides with an 11.01% drop in average order value on digital channels. Customers are not abandoning the site entirely they are buying less per visit. The redesign appears to be burying higher value products or creating friction in the discovery experience.
Hypothesis 2 — Southwest and West Coast regions have higher cancellation and return rates
I queried cancellation and return rates broken down by sales region to assess whether the issue was regional or systemic.
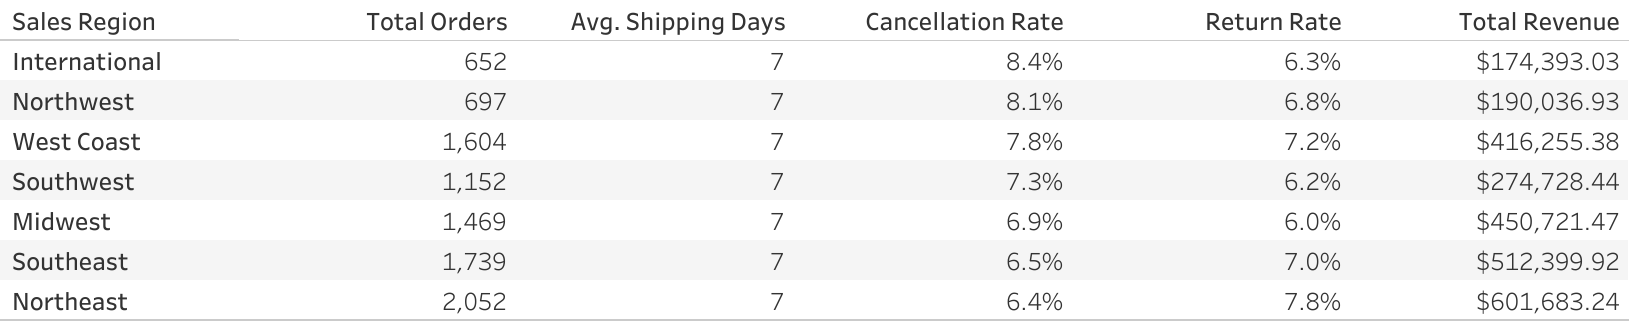
Finding: Average delivery times ranged from 6.7 to 7.2 days across every region. Well beyond the 3 to 5 day promise. The fulfillment gap is not isolated to the Southwest. It is a systemic operations failure.
Hypothesis 3 — Loyalty program members are not returning to purchase
I analyzed purchase behavior by customer tier to measure program engagement and retention.
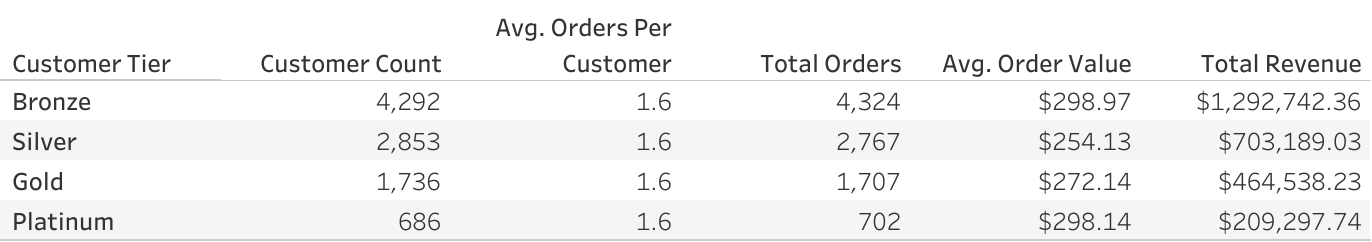
Finding: Thousands of enrolled loyalty members have never made a purchase. Among those who have, the average customer orders exactly once regardless of tier. Higher tier customers are actually spending less per order than Bronze tier customers. Empire Rewards is measuring enrollment and email engagement, not retention, the only metric that matters.
Dashboard
All findings are presented in a three tab Tableau dashboard, with one tab per hypothesis and three prioritized recommended actions per tab.
What I Learned
This project delivered a complete end-to-end business analysis engagement. I profiled and cleaned a deliberately dirty 9,500 row dataset, validated three hypotheses using SQL window functions and aggregations, and translated data findings into executive level recommendations.
Skills demonstrated:
- Applied use of generative AI to create ethical data
- Multi-round data cleaning and debugging in SQL
- Hypothesis driven analysis using CTEs, window logic, and aggregations
- Translating technical findings into business language
Conclusions
Consumer Empire entered this engagement facing broad, unexplained customer decline. The analysis identified three interconnected root causes:
- Average order value fell from $299.43 to $266.46 following the March 2023 navigation redesign
- Cart abandonment increased from 68% to 76%
- Every loyalty tier averaged 1 to 2 lifetime orders per customer
- Actual delivery times averaged 7 days against a 3 to 5 day promise
The navigation redesign disrupted product discovery for browse dependent categories. Customers who search directly for products continue to purchase at comparable rates. Customers who rely on navigation to discover products are either abandoning their sessions or settling for lower value items that are easier to locate. This is a discovery problem, not a demand problem.
Recommended Actions | # | Action | Timeline | | --- | -------------------------------------------- | ---------- | | 1 | Stop discounting broken fulfillment promises | Immediate | | 2 | UX navigation audit | 2 weeks | | 3 | Redefine loyalty program success metrics | 2 weeks | | 4 | First purchase activation campaign | 3 weeks | | 5 | Fulfillment SLA audit | 3 weeks | | 6 | A/B test menu restoration | 4 weeks | | 7 | Backfill Phoenix warehouse supervisors | 4 weeks | | 8 | Implement category discovery tracking | 6 weeks | | 9 | Second purchase activation campaign | 6 weeks |
Restoring average order value to pre-March levels represents $56,166.32 in annually recoverable revenue at current volume. As retention improves, customers begin returning for second purchases. It’s currently averaging 1 per customer at every loyalty tier. The compounding revenue impact will substantially exceed this baseline.